MT122 & Smaart
Printed From: Speakerplans.com
Category: Plans
Forum Name: MT122
Forum Description: Discussion / Questions about the MT122
URL: https://forum.speakerplans.com/forum_posts.asp?TID=78693
Printed Date: 26 March 2026 at 11:31pm
Software Version: Web Wiz Forums 12.08 - https://www.webwizforums.com
Topic: MT122 & Smaart
Posted By: Aaronski
Subject: MT122 & Smaart
Date Posted: 09 May 2013 at 10:17pm
|
please dont shoot me down straight away as im still learning. took a plot of my mt and i have a massive dip in the response around 1Khz I have the drivers in phase. unfortunately i didnt take an over all response, but its much that same as u see here the problem is that the drivers dont over lap when the crossover is turn off (full range) http://s1109.photobucket.com/user/Aaronski1992/media/upload.jpg.html" rel="nofollow"> 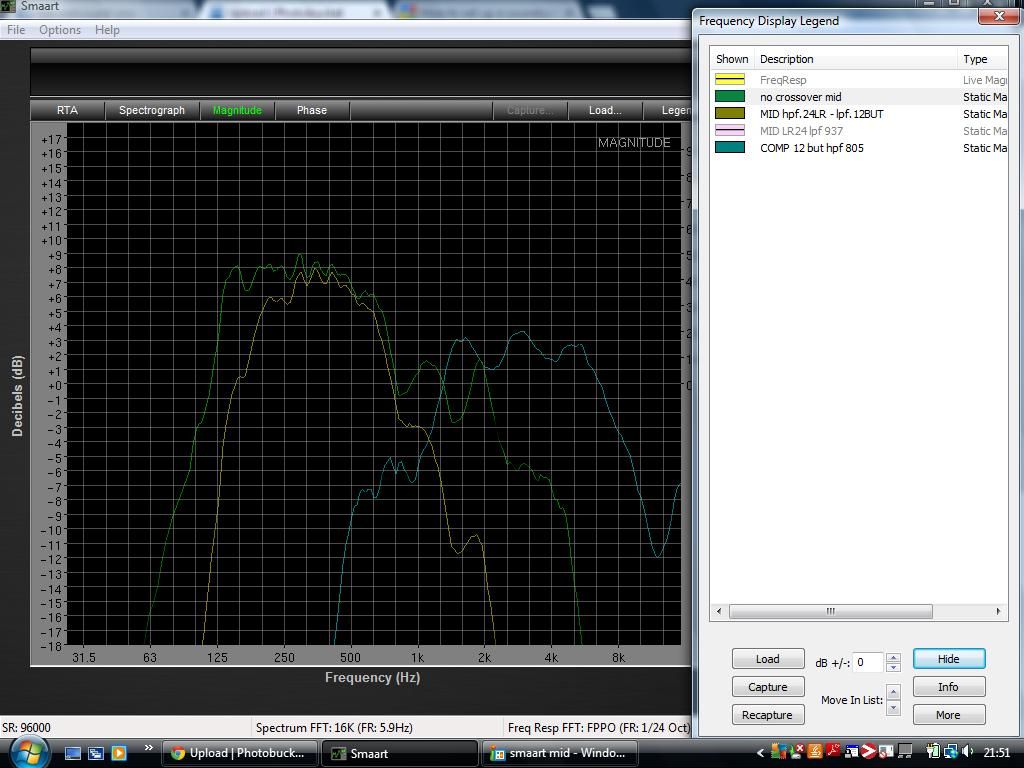 green line is the mid with no crossover (full range) yellow line is the mid with a LPF of 937hz - why do both slopes (green & yellow) go down together surely the green line should go a lil higher or is comb filtering coming in to play? blue line is the comp with a HPF of 805hz- clearly the comp isnt play down that low what do u people suggest? using PD123er Beyma cp750ti and PH2723 where do people cross the mt122 over?
------------- corr that sounds well good, how many k is it pushin? what amps you got? turn it up abit mate. |
Replies:
Posted By: cravings
Date Posted: 09 May 2013 at 10:40pm
| i didn't save the plots, but when i had a quick go at measuring mine, the 12" section didn't do anything really above 900hz too... |
Posted By: Aaronski
Date Posted: 09 May 2013 at 10:45pm
|
what comp do u use? and what crossover setting ------------- corr that sounds well good, how many k is it pushin? what amps you got? turn it up abit mate. |
Posted By: cravings
Date Posted: 09 May 2013 at 11:05pm
|
i have these http://www.eighteensound.it/index.aspx?mainMenu=view_product_simple&pid=183" rel="nofollow - eighteen sound nd1480 on the xt1464 horn.. plan is to build some xtro 8" sections and then start playing with them and 1" drivers to see how it goes though. ages ago there was a mid top shootout / session.. rog was there measuring, porn horns and mt121s and bokes.. i'm sure i remember from then that the 12 only went up to about 900 too. |
Posted By: MarjanM
Date Posted: 10 May 2013 at 12:42am
|
Try reverse polarity on the HF. Play the 12 up to like 2khz and measure the response again.
Anyhow i am really puzzled about the HF response. Should go lower. ------------- Marjan Milosevic MM-Acoustics www.mm-acoustics.com https://www.facebook.com/pages/MM-Acoustics/608901282527713 |
Posted By: ceharden
Date Posted: 10 May 2013 at 3:27am
|
Also try measuring in some different positions in case the 1kHz dip is being caused by a reflection from another object, the ground etc. The scale you are using on the Y axis is making it look slightly worse than it actually is. If you look at a lot of published SPL plots they will have a much wider range on that axis which will make the dips and bumps look a lot smaller. I'm not entirely surprised by the results. A 12" on a non phase-plugged horn and a 2" on a fairly compact horn will only just meet in terms of frequency range. |
Posted By: Aaronski
Date Posted: 10 May 2013 at 7:59pm
all though i haven't physically moved the cab, i have move the mic around. i have the mt sitting on another cab about 1meter high. the measurement i posted is with the mic 1 meter away at the compression driver height, is it still possible that i would get reflections at this distance? i am indoors because i dont want the wind noise ect from outside. the room is 20x20ft with the cab facing out the big double barn doors. ------------- corr that sounds well good, how many k is it pushin? what amps you got? turn it up abit mate. |
 ceharden wrote:
Posted By: bee
Date Posted: 10 May 2013 at 8:41pm
|
where your taking the plotts could be causing an issue, the 12 looks like its not playing low enougth or high enougth, one tip i tell people to do mith the mt is to let the 12 roll out naturally and bring in the hf from 900 to 1k region.... there is a natural dip around the 1k region with the mt, but not as low as your plotts show..... The best option is to pick a non windy day and take plotts outside at least 10m away from any buildings walls etc..... Ill try and find the plotts i done on the 122 and 121, there on my old laptop..... the green plott looks about right for the low end........ but the top end looks wrong....
------------- https://www.elements-audio.com |
Posted By: bee
Date Posted: 10 May 2013 at 8:46pm
|
looking at the plott your input gain on the rta mic looks to be a bit hot...... you want it around the 0 mark not plus 9............. ------------- https://www.elements-audio.com |
Posted By: MarjanM
Date Posted: 10 May 2013 at 9:45pm
|
Please, take a measurement of the full range. So no HPF on the 12, no LPF on the 12 and 900Hz LPF on the HF. You need to make the correct gain so the lf and hf are on the same level. Looks like that if you put some gain on the hf and reverse the polarity the deep will not be that big. So one graph on both lf and hf. ------------- Marjan Milosevic MM-Acoustics www.mm-acoustics.com https://www.facebook.com/pages/MM-Acoustics/608901282527713 |
Posted By: ceharden
Date Posted: 10 May 2013 at 11:31pm
|
Try measuring the 12" section with both the cab and the mic on the floor (just put a bit of foam etc under the mic). Reflections off the floor could easily cause some odd results in that frequency range. |
Posted By: Steve_B
Date Posted: 10 May 2013 at 11:48pm
Re-read the original post.
For these plots, the polarity of either is irrelevant. @Aaronski One of the things that makes your graphs look so alarming is the large vertical (amplitude) scale. The upper roll off rate of the mids is the combined response of the acoustic and electronic slopes. The acoustic roll off between 500Hz and 900Hz is dominant which is why adding the crossover (electronic filter) doesn't alter things much. You can see that with the crossover the frequencies above 900Hz are attenuated, which is what you would expect with a 937Hz LP filter. The plots show that the HF section is about 6dB below the mid section level. You need to either turn up the gain on the HF or down on the MF until the flattish sections of each plot are level. Simply turning the HF up by 6dB will put the acoustic crossover point at around 900Hz, which is about right. and about -6dB below the bandpass levels. Depending on the phase alignment between the sections this should sum reasonably well. What crossover are you using? If you have a digital one with parametrics and delays I can suggest some adjustments.
|
Posted By: MarjanM
Date Posted: 11 May 2013 at 12:13am
|
Steve, i guess is the resin fumes from today's work so i dont express my self as clear as needed. What i was asking is an overall response plot. With no LPF on the 12 and both normal and reverse polarity on the HF. On the overall response graph the polarity will have an effect.
------------- Marjan Milosevic MM-Acoustics www.mm-acoustics.com https://www.facebook.com/pages/MM-Acoustics/608901282527713 |
Posted By: bee
Date Posted: 11 May 2013 at 12:16am
|
plus 1 steve.... marganm plus 1/2 not sure how reversing the polarity for the reading will help.... ive never done this, please explain why this helps..... cheers.... ------------- https://www.elements-audio.com |
Posted By: Steve_B
Date Posted: 11 May 2013 at 12:43am
|
If you are measuring the combined response and flip the polarity of one of the drive units the combined outputs will cancel at the crossover point causing a dip in the response. Showing plots for both would show which way would be best. The actual graph would be no clearer to read. The problem, based on the plots shown, is that the upper end of the mid response barely reaches the bottom end of the high response. Plus, given that the Op is using Smaart, it would be simpler just to show the phase plots. Here is an example of reversing the HF polarity. This is a passive EV box.  White and green plots are pole mounted and the brown is with the speaker on the floor in monitor mode.
|
Posted By: MarjanM
Date Posted: 11 May 2013 at 12:44am
|
It wont help when reading the hf and lf separately, but it will help for the overall response. Depending on which crossover slopes he use it will make a difference. Per instance 24db LR slope usually shift the hf phase for 180 degrees. So the HF polarity has to be reversed. Aslo i would recommend measuring the box at a bit bigger distance. 1m is too close for this type of boxes. Another thing, is the HF delayed to the 12 inch? ------------- Marjan Milosevic MM-Acoustics www.mm-acoustics.com https://www.facebook.com/pages/MM-Acoustics/608901282527713 |
Posted By: bee
Date Posted: 19 May 2013 at 10:36pm
|
Great tip steve cheers, nether thought of doing it this way..... ------------- https://www.elements-audio.com |